By James Whitacre
Did you know that George Washington was a cartographer? Well, technically his training was in surveying, but back in his time, surveyors would typically create beautiful maps to show off their surveys. Other famous Americans, such as Thomas Jefferson, Abraham Lincoln, and both Meriwether Lewis and William Clark, were also surveyors.
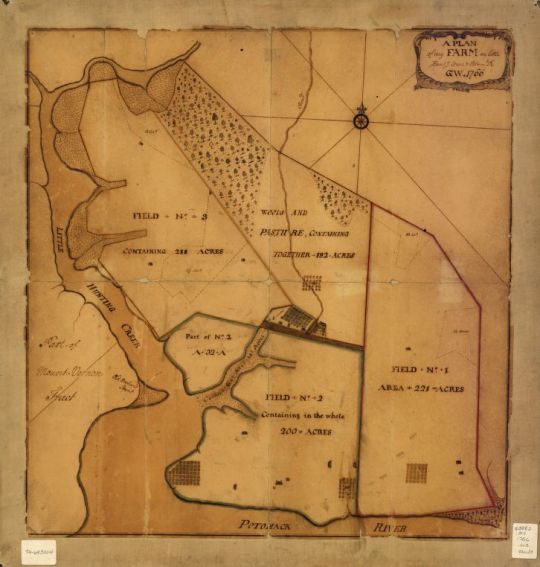
The map below is of one of Washington’s many farms near Mount Vernon, VA, which shows off his stellar map-making skills. Around the time when Washington was surveying land, the profession was gaining more ground as the industrial revolution was taking shape and the US was expanding.

A plan of my farm on Little Huntg. Creek & Potomk. R., George Washington, 1766; Source: Library of Congress
As I look in awe at Washington’s map, I can’t help but wonder how surveyors and cartographers collected and visualized their geospatial data before computers and GPS were around. It truly is a great mix of science and art. However, Washington and his fellow surveyors of antiquity used much different techniques than we use today.
Surveyors would use chains, rods (which were literally poles of a fixed length), and a surveyor’s compass or a Theodolite to quickly measure distances and angles. The Gunter’s Chain measured 66 feet long and contained 100 links. This chain could be used to measure many other lengths, for instance a rod (aka a pole or perch) equaled 25 chain links (16.5 feet), 10 chains equaled a furlong (660 feet or 1/8 mile), and 80 chains equaled one mile (5,280 feet). Further, an acre is defined as a one chain by one furlong (66 by 660 feet), which is 43,560 square feet (Are you able to follow all that math?).
The Theodolite contains an optical telescope with cross-hairs that is used to sight direction and then the angle or bearing can be read off a scale. Surveyors would also use sophisticated instruments such as zenith telescopes, sextants, or octants to determine the positions of the sun or stars which could also help with determining latitude and longitude.
By recording the measurements and angles or bearings from these instruments, surveyors would describe the land using a system called metes and bounds. This system also incorporates physical features, such as trees, stones, and streams, to describe the boundaries. Metes and bounds were originally used in England, and it is still used today, even in Pennsylvania. The image below is an example from one of Powdermill’s metes and bounds descriptions. Surveyors and cartographers can decipher these descriptions and use geometry (which comes from the Greek “earth measurement”) to find property boundaries in the field, or draw and chart the measurements on to paper, thus creating maps.

Example of Metes and Bounds description from Powdermill Nature Reserve; Source: Westmoreland County, PA, Recorder of Deeds
At the Geographic Information Systems (GIS) Lab at Powdermill Nature Reserve, we spend a lot of our time collecting scientific data for research in the field so that it can be mapped and analyzed. Today, however, we use sophisticated GPS units, mobile devices, and high-end GIS software to help us efficiently collect, analyze, and visualize our field data. Stay tuned for my next blog post where I will discuss how GPS works and how we use it in our everyday research at Powdermill Nature Reserve.
James Whitacre is the GIS Research Scientist for Carnegie Museum of Natural History, where he primarily manages the GIS Lab at Powdermill Nature Reserve, the Museum’s environmental research center. Museum employees are encouraged to blog about their unique experiences and knowledge gained from working at the museum.
