• Skip to primary navigation
  • Skip to main content
  • Skip to primary sidebar

Carnegie Museum of Natural History

One of the Four Carnegie Museums of Pittsburgh

  • Visit
    • Buy Tickets
    • Visitor Information
    • Exhibitions
    • Events
    • Dining at the Museum
    • Celebrate at the Museum
    • Powdermill Nature Reserve
    • Event Venue Rental
  • Learn
    • Field Trips
    • Educator Information
    • Programs at the Museum
    • Bring the Museum to You
    • Guided Programs FAQ
    • Programs Online
    • Climate and Rural Systems Partnership
  • Research
    • Scientific Sections
    • Science Stories
    • Science Videos
    • Senior Science & Research Staff
    • Museum Library
    • Science Seminars
    • Scientific Publications
    • Specimen and Artifact Identification
  • About
    • Mission & Commitments
    • Directors Team
    • Museum History
  • Tickets
  • Give
  • Shop

Blogs about the Anthropocene

Scientists use fossils and other traces to understand how the planet changed over time. In the past these changes were caused by forces like volcanic eruptions and shifts in oceans currents. Now there’s a new force of nature shaping the planet: humans. The effects on air, land, and water are significant enough that scientists propose we are a new geological time – the Anthropocene – or age of Humans.

These blogs are about the many facets of human impact on the Earth, documenting this new age.

August 16, 2018 by wpengine

Mapping Pittsburgh’s Plastic Waste

By James Whitacre

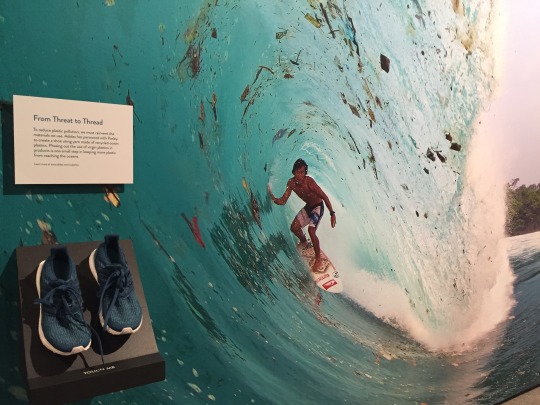
If you have visited the museum recently, you have probably seen the We Are Nature: Living in the Anthropocene exhibition (if not, you have less than a month to check it out!!). When I walked through the exhibition the first time, I was struck by the image of the surfer gliding across a wave with plastic and other debris floating all around him. It is a bleak image of how the beauty and ecology of our oceans, rivers, and lakes is being tarnished and even destroyed by the accumulation of so much plastic waste.

surfer in wave with plastic

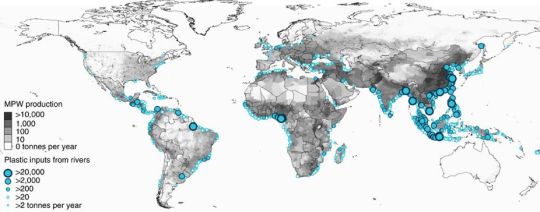
Recently, I also came across an interesting 2017 article, ‘River plastic emissions to the world’s oceans,‘ in which the authors have developed a global model using spatial and temporal data on waste management, population density, and hydrology to measure the amount of plastic in rivers that makes its way into oceans. They found that the top 20 polluting rivers account for 67% of the global total of plastic waste, which is between 1.15 and 2.41 million tonnes of plastic a year. While most of the top 20 rivers are in Asia, and none are in the U.S., their findings have great implications for how plastic waste should be managed and mitigated at global and local scales.

Diagram of mass of river plastic flowing into oceans in tonnes per year.
Mass of river plastic flowing into oceans in tonnes per year. This work is licensed under a Creative Commons Attribution 4.0 International License. Source: https://www.nature.com/articles/ncomms15611/figures/1


This article got me thinking…How can we, as humans living in the Anthropocene, do something to decrease and even eliminate the accumulation of plastic in our waterways? Many people are thinking about this, but what about our beloved three rivers of Pittsburgh? How much do we as a community contribute to the global plastic waste epidemic? Well, to start answering these questions, we need data to know where the plastic waste is…

How often have you walked through your neighborhood, a local or state park, or even been driving around, and noticed plastic waste (and likely other trash)? With this in mind, we’d like to invite you into an experiment…to help us map Pittsburgh’s plastic waste. The GIS Lab, located at Powdermill Nature Reserve, has developed a simple mapping survey to help track plastic waste in our area. To participate, all you have to do is fill out the form using your GPS-enabled smartphone or mobile device when you encounter plastic waste:

Plastic Waste Survey


What will we do with this data?

Well, right now this is just an experiment…But we are thinking of some cool ways to map and analyze this data. We will definitely share a map that shows the data, so stay tuned. We would also like to help our community understand what happens to the plastic if left in the environment. So, here are some example research questions we hope to shed some light on in the near future:

  • If you find some plastic near your house, what stream will it end up in, and what is the shortest path to the ocean from there?
  • How much rain or wind would it take to move that plastic to a stream or river?
  • Where is the nearest recycling center that I can take a few bags or a large heap of plastic (and other) waste?

Data can be very powerful, and sometimes more powerful than we can imagine on our own. So if you have any other ideas for how we could use this data, please email the GIS Lab!

What is Survey123?

The GIS Lab used Survey123 to build this survey, which is part of the ArcGIS platform. Survey123 for ArcGIS is a simple and intuitive form-centric data gathering solution that makes creating, sharing, and analyzing surveys easy using GIS software. Download the free Survey123 app to use the form we created.

James Whitacre is the GIS Research Scientist for Carnegie Museum of Natural History, where he primarily manages the GIS Lab at Powdermill Nature Reserve, the museum’s environmental research center. Museum employees are encouraged to blog about their unique experiences and knowledge gained from working at the museum.

Filed Under: Blog Tagged With: Anthropocene, GIS lab, Pittsburgh, Powdermill Nature Reserve, We Are Nature: Living in the Anthropocene

August 13, 2018 by wpengine

Killer Sea Snails: Cure for the Opioid Crisis?

By Tim Pearce

Carnivorous and predatory, killer cone snails (genus Conus) stun their prey by injecting peptide neurotoxins called conotoxins. These peptides are short proteins, mostly 12-30 amino acids long.

Of the approximately 600 species of cone snails, two species have killed humans: the geography cone (Conus geographus) and the textile cone (Conus textile). Those species occur in the South Pacific and Indian Oceans.

cone snails
Geography cone (Conus geographus), a sea snail with venom powerful enough to kill humans. Specimen CM 73476, photo by Tim Pearce.


Each cone snail species produces more than 100 conotoxins, with an estimated 5% overlap in conotoxins among species [1]. Although only about 0.1% of these >50,000 peptides have been characterized, many have already been recognized to have pharmaceutical uses: six for pain, three for cardiovascular issues, one for epilepsy, and one for mood.

A potentially useful medicine from the venom of fish-eating cone snails is insulin, which acts faster than human insulin [2]. The cone snail insulin is a single molecule that acts within 5 minutes. In contrast, human insulin is stored as a cluster of six insulin molecules that must separate to become active, and separation can take 60 minutes (or 15-30 minutes for modified human insulin). The cone snail uses its insulin to immobilize fish by hypoglycemic shock (caused by extremely low blood sugar), making prey easier to catch. Researchers are studying cone snail insulin for ideas to make better insulin for use in humans.

Another medicine currently used in humans is the pain killer ziconotide (Prialt). It is more powerful than morphine, not addictive, and people don’t build up a tolerance. However, it doesn’t cross the blood-brain barrier so must be injected directly into spinal fluid. The FDA approved it in 2004 for end-of-life cases (pain management). Scattered reports suggest an odd side effect: people who take Prialt hear music in their heads. Researchers continue studying ways to get the peptide across the blood-brain barrier. Success could mean an alternative to opioid drugs, and potentially a powerful tool for solving the opioid crisis.

“Better living through snails!”

Fun Fact: Sunken ships provide habitat for many undersea creatures including cone snails.

Riddle: What lies at the bottom of the ocean and twitches?

Answer: A nervous wreck!

Timothy A. Pearce, PhD, is the head of the mollusks section at Carnegie Museum of Natural History. Museum employees are encouraged to blog about their unique experiences and knowledge gained from working at the museum.

Notes:

[1] Davis, J., Jones, A. & Lewis, R.J. 2009. Remarkable inter- and intra-species complexity of conotoxins revealed by LC/MS. Peptides, 30(7): 1222-1227.

[2] Safavi-Hemamia, H., Gajewiak, J., Karanth, S., Robinson, S.D., Ueberheide, B., Douglass, A.D., Schlegel, A., Imperial, J.S., Watkins, M., Bandyopadhyay, P.K., Yandell, M., Li, Q., Purcell, A.W., Norton, R.S., Ellgaard, L. & Olivera, B.M. 2015. Specialized insulin is used for chemical warfare by fish-hunting cone snails. Proceedings of the National Academy of Sciences, 112(6): 1743-1748.

Filed Under: Blog Tagged With: Anthropocene, mollusks, Tim Pearce

July 30, 2018 by wpengine

None Like It Hot

By Joylette Portlock

July. Long known across the U.S. for fireworks, barbecues, and a desire to stay cool any way we can. Whether it’s air conditioning, swimming pools, beaches or popsicles, the dog days of summer are often reminders that as humans, our comfort depends on an experienced ambient temperature roughly somewhere between 59 and 77 degrees (Fahrenheit).

But what if, instead of 77, it’s a full 40 degrees more: 117 degrees, like it was in California on July 6? Or 105, like it was in Japan last week? Then, it’s more than an issue of comfort; our lives depend on finding a way to stay cool, and in fact more than a hundred people have perished in heat-related deaths globally already this year.

Life in this new age, the Anthropocene, is marked by many things, including a human-caused increase in global heat, commonly referred to as global warming, or climate change. Risk from heat (or wildfires, or floods) is no longer something we have to rely on the overwhelmingly strong scientific consensus about global warming to tell us; every year, climate change impacts are becoming more and more obvious to everyone, whether you have a degree in climate science or not.

Weather and climate are different. Weather is what happens on a day-to-day basis. Climate is the range of weather that we expect and consider normal (i.e., summer is hot) – but normal is changing.

Graph showing the amount of CO2 in the atmosphere and human population
Photo: Graph showing the amount of CO2 in the atmosphere and human population from We Are Nature, on display until September 2018.

We’re now up to over 400 consecutive warmer-than-average months and counting. Carnegie Museum of Natural History’s collections, which span more than 140 years, can help show these shifts in many ways. One of the most important things we can do is to make connections and show the relevance between the basic scientific principles underlying natural phenomena and the evidence all around us; between what’s happening globally and what’s happening locally.

side by side comparison of plant specimens collected 100 years apart
Photo: The growth of plants collected today versus 100 years ago in the same locations, shown in We Are Nature, corroborates the observation of increasingly earlier springtime by documenting earlier maturation of these species.

The globe’s increasing heat is a result of fossil fuel use, food production, and our land use practices. We need energy and food, of course; but it’s critical that we recognize that the systems we impact also impact us. It’s not just our actions, but our interactions with the world around us that are the story. To understand what’s happening and improve our interactions with nature, we have to look at the big picture, and work to meet our needs in ways that minimize disruption to the overall system.

As summer heat waves get longer, more numerous, and more intense (and it seems the whole world is on fire, with deadly fires everywhere from California to Greece to inside the Arctic Circle) one connection is obvious: our need to be cool.

Joylette Portlock, Ph.D., is associate director of science and research at Carnegie Museum of Natural History. She is also executive director of Communitopia, a nonprofit focused on climate change communication, and holds many other roles in the community.

Filed Under: Blog Tagged With: Anthropocene, climate change, global warming, We Are Nature, We Are Nature: Living in the Anthropocene

July 26, 2018 by wpengine

New Member of the Section of Herpetology

By Jennifer Sheridan

The Section of Herpetology has welcomed a new curator—me! I’m happy to be writing this blog post as a way of introducing myself and to be joining the Carnegie Museums family.

I moved here from Singapore, where I was Assistant Professor of Environmental Studies for the past four years at Yale-NUS College, a small liberal-arts college entering its sixth year of operation. It was fantastic, but I’m very much looking forward to my new role as curator. People often ask me what exactly a curator does, and in my case, it won’t be too different from my job as a professor: my time will be divided between research & curation, outreach & education, and service to the museum (providing input for exhibits, for example). At Yale-NUS, about two-thirds of my time was teaching (education) and service, and about one-third was research, so I’m looking forward to being able to devote a larger portion of my time (closer to 50%) to research now that I’m here.

Additionally, it’s exciting to have such a great collection on hand with which to answer questions about ecological responses to climate change, one of the main foci of my research. In fact, a recent paper of mine relied heavily on specimens from the Carnegie Museum of Natural History. My co-authors and I used more than 350 specimens from this museum, plus more than 900 specimens from 15 other museums, collected between 1901–2000, to examine how wood frog body size and breeding have shifted in response to climate change.

maps showing body size changes
Image credit: Nick Caruso

We found that breeding and size shifted as predicted at broad spatial scales, but when we examined the data at finer spatial scales, local changes in climate did not accurately predict local body size changes. This suggests that climate itself is not the driving factor of observed body size changes, but rather that there is another mechanism driving such changes, that also correlates with climate. Moving forward, I’ll be combining examinations of the collections with field work to uncover other ways that amphibians have responded to climate change, whether through shifts in body size, breeding date, or geographic range, and what impacts that might have on ecosystem function. I’m excited to be here with such great resources for answering these interesting questions!

Jennifer Sheridan is the Assistant Curator in the Section of Herpetology at the Carnegie Museum of Natural History. Museum employees are encouraged to blog about their unique experiences and knowledge gained from working at the museum.

Filed Under: Blog Tagged With: amphibians, Anthropocene, climate change, herpetology, Jennifer Sheridan, reptiles

July 13, 2018 by wpengine

Migrate or Die

By Dr. Nicole Heller

Becoming Migrant was this year’s theme for the Carnegie Nexus. The series explored the science and art of passage through creative programming. Migration is a very important issue for wildlife conservation in the Anthropocene. Roads and building developments heavily fragment landscapes, leading more animals to be hit by cars or run into trouble with people. Movement is especially hard for animals that don’t fly and need large home ranges to gather sufficient food, such as American Black Bears and bobcats, two large mammal species that live here in Allegheny County.

baby black bear taxidermy
Baby black bear, Ursus americanus, on display at Powdermill Nature Reserve.

Conservation has long recognized the need to create connectivity between protected areas to support the movement of large mammals in the landscape, but with climate change, connectivity has become paramount to the long-term success of protected areas and species in general.  As the climate changes, plants and animals must migrate to track suitable climate conditions.  This means that more species are becoming migrant, and their long-term survival depends on it.

Prioritizing connectivity planning and making sure we do it in ways that are climate-smart is a leading edge of conservation science.  There are many different types of corridor projects, from building crossings over particularly dangerous roads, such as the Liberty Canyon Wildlife Crossing in Los Angeles, CA. Or large-landscape connectivity projects to create continental migration pathways such as Y2Y project.

I first wrote about climate adaptation 10 years ago. In this research, I identified that the most impactful thing we could do to help species survive climate change is to create habitat connectivity in the landscape. Recently, I published two scientific articles, with a group of colleagues, further exploring the issue of climate change and connectivity. In one paper, published in Environmental Research Letters, we explore the best models and methods for incorporating climate change into connectivity conservation planning. And in the other paper, published in Conservation Biology, we consider best practices to take corridors from idea to implementation on the ground.

We hope this information will be helpful to conservation groups around the world who are working to make sure the landscape supports wildlife today and into the future.

Dr. Nicole Heller is Curator of the Anthropocene for Carnegie Museum of Natural History. Museum employees are encouraged to blog about their unique experiences working at the museum.

Filed Under: Blog Tagged With: Anthropocene, climate change, Nicole Heller, We Are Nature, We Are Nature: Living in the Anthropocene

July 2, 2018 by wpengine

Counting Your Chickens: The World’s Most Numerous Bird

By Eric Dorfman

View this article on Eric’s blog

image

If you Google “the world’s most numerous bird,” you will likely be given articles about the Red-Billed Quelea (Quelea quelea), also known as the Red-Billed Weaver Bird or Red-Billed Dioch that lives across most of sub-Saharan Africa. It’s considered the most numerous wild bird on earth,  the population sometimes peaking at 1½ billion individuals.

Individually, it’s a pretty little bird. Breeding males have a black facial mask, surrounded by a purple, pink, rust, or yellow wash on their head and breast. It wouldn’t be hard to imagine keeping them as pets. In fact, some people do.

image

Collectively, however, it’s something of a phenomenon. It feeds in huge flocks of millions of individuals, with birds that run out of food at the rear flying over the entire group to a fresh feeding zone at the front, creating an image of a rolling cloud. They avoid forests, preferring open scrubby habitat – exactly the kind of environment that results in land clearing for agriculture, where their massive numbers have made them a severe pest to farmers. It’s a positive feedback loop that speaks directly to the Anthropocene and the scourges humanity creates for itself when emptying the landscape of it’s natural diversity.

I could go on about the Quelea and sub-Saharan Africa, but I won’t. That’s because I want to talk about the world’s most numerous bird, and it’s not the Quelea, but the Domestic Chicken (Gallus gallus domesticus). In preparing for this post, I wanted to find out how many chickens actually exist worldwide. It’s not as easy as you might think. Estimates vary widely in the media, so I went to the source: the Food and Agriculture Organization of the United Nations (FAO). They have a very handy calculator (FAOSTAT) that allows you to tally up the number of  chickens – or just about anything – produced for food in any country, between 1961 and 2016. I had a look at chickens out of curiosity, but aside from telling a story about food security, it also points to social equality and intangible natural heritage.

image

In 2016, worldwide, almost 66 billion chickens were produced. That’s a lot. The most numerous wild bird ever known, the Passenger Pigeon (Ectopistes migratorius) probably only ever reached a total population of 5 billion. China leads the pack with 9.6 billion chickens produced, followed by the USA, with 8.9 billion. Brazil is next, with about 6 billion and then Indonesia and India, each with about 2.5 billion. It tails off relatively quickly after that.

What’s more sobering however, is that the global tally is up from only 7.5 billion chickens 55 years earlier. Comparing it to the human population, however, is where it gets really interesting. In 1961 (December figures), there were just over 3 billion people worldwide (data from World Bank). In 2016, the human population was almost 7. 5 billion. This means that in 1961, there were 0.0024 chickens per person, or one chicken for about 400 people globally, whereas in 2016 there were 8.82 chickens for every person.

image

People are starting to think a lot about the the way the the Earth’s crust will look in the future, especially through the lens of the Anthropocene. In 2016, Damian Carrington of The Guardian, wrote a compelling article demonstrating how the domestic chicken will define much of the present-day global landscape as it’s represented in the fossil record of the next millennia. It seems undeniable.

I’m left wondering what it says about our changing relationship with nature as a context, and a commodity. We are more distant from nature and perhaps this makes us more rapacious. Is this just a Western phenomenon? Are we so distracted by our First World Problems that we aren’t noticing what we’re doing to the rest of the planet? Perhaps. Out of curiosity, I wanted to see the difference in ratio between 1961 and 2016 between the United States and the Developing World. I picked Kenya, in lieu of doing a robust analysis.

image

So. Both countries increased their production by about 360% between 1961 and 2016. However, over that time, whereas America’s human population increased by 176% (2.6B to 9.6B), Kenya’s population increased by a whopping 580% (8.36M to 48.46M). This means that the chickens that were produced had to be spread across a lot more people.

American chicken consumers were clear winners in this comparison. Here, the population of chickens went up from 14 birds for every person in the country to 30 birds per person. By stark contrast, the ratio of chickens to people in Kenya went down from roughly on bird for every person to about one bird for every two people. This semi-natural biological resource has become twice as scarce in Kenya over three generations. As human populations continue to increase over the next decades, questions about how biological entities interface with human survival (and, of course, their own) will become ever more pressing.

image

Does each American need 30 chickens? Perhaps not. In 2013–2014, the National Center for Health conducted a survey of obesity in the United States. Almost 3 in 4 men (73.7%) were considered to be overweight or have obesity, and about 2 in 3 women (66.9%) were considered to be overweight or have obesity. The same surveydemonstrated that a quarter of all people in the US to die between ages 24 and 65 were related to obesity. Our evolutionary drive that makes us strive always for ‘more’ can cloud our judgement, which is detrimental to our health and that of the planet.

The Anthropocene is concerned with the trace we leave behind in the geological record of the distant future. So on some level, the Anthropocene conversation intertwines ideas about how we commodify nature; create, distribute and transport resources; how societies treat one another; and – perhaps most fundamentally – how we view ourselves as part of the global ecosystem.


Eric Dorfman is the Daniel G. and Carole L. Kamin Director of Carnegie Museum of Natural History. Eric oversees strategic initiatives, operations, and research at the museum. He is an active advocate for natural and cultural heritage and has published books on natural history and climate change, as well as children’s fiction and scholarly articles on museology and ecology.


Filed Under: Blog Tagged With: Anthropocene

  • « Go to Previous Page
  • Page 1
  • Interim pages omitted …
  • Page 11
  • Page 12
  • Page 13
  • Page 14
  • Page 15
  • Page 16
  • Go to Next Page »

sidebar

About

  • Mission & Commitments
  • Directors Team
  • Museum History

Get Involved

  • Volunteer
  • Membership
  • Carnegie Discoverers
  • Donate
  • Employment
  • Events

Bring a Group

  • Groups of 10 or More
  • Birthday Parties at the Museum
  • Field Trips

Powdermill

  • Powdermill Nature Reserve
  • Powdermill Field Trips
  • Powdermill Staff
  • Research at Powdermill

More Information

  • Image Permission Requests
  • Science Stories
  • Accessibility
  • Shopping Cart
  • Contact
  • Visitor Policies
One of the Four Carnegie Museums | © Carnegie Institute | Privacy Policy | Terms of Use | Accessibility
Rad works here logo