• Skip to primary navigation
  • Skip to main content
  • Skip to primary sidebar

Carnegie Museum of Natural History

One of the Four Carnegie Museums of Pittsburgh

  • Visit
    • Buy Tickets
    • Visitor Information
    • Exhibitions
    • Events
    • Dining at the Museum
    • Celebrate at the Museum
    • Powdermill Nature Reserve
    • Event Venue Rental
  • Learn
    • Field Trips
    • Educator Information
    • Programs at the Museum
    • Bring the Museum to You
    • Guided Programs FAQ
    • Programs Online
    • Climate and Rural Systems Partnership
  • Research
    • Scientific Sections
    • Science Stories
    • Science Videos
    • Senior Science & Research Staff
    • Museum Library
    • Science Seminars
    • Scientific Publications
    • Specimen and Artifact Identification
  • About
    • Mission & Commitments
    • Directors Team
    • Museum History
  • Tickets
  • Give
  • Shop

Anthropocene Studies

September 9, 2020 by wpengine

From the Allegheny to our Kitchen Sinks

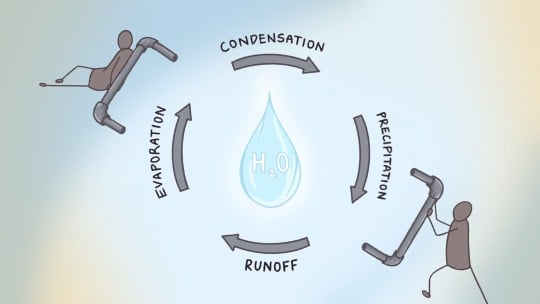
There are more than 326 million trillion gallons of water on our planet. Our bodies are made up of around 60% water. Even the air that we breathe has water vapors in it. Water is everywhere, but the water we can use is limited. According to the National Groundwater Association, the Earth is made up of about 71% water. Out of that, 99.7% is trapped in oceans, icecaps, soil, and the atmosphere. That leaves us with around 0.3% of the Earth’s water to use and drink. The same water that all living and nonliving things have used again and again since water has been on the planet.

drawing of people drinking water

Every morning I go downstairs to the kitchen and pour myself a glass of cold water from a water filter. Without a second thought, I drink the water because I consider this water to be safe. After all, the porous, activated carbon filters absorb various chemicals, including chlorine, lead, and mercury, which ‘purifies’ the water. Furthermore, I don’t have to worry about what could be in the water, because I know that the water is thoroughly cleaned before it enters the house. But how is it cleaned? Where does this water come from and what does it go through in order to splash into my kitchen sink?

Let’s start with a broader concept: rivers. Most major cities can be found along rivers: Paris along the Seine River, London along the River Thames, Seoul along the Han River, and New York along the Hudson River. This is no surprise, as communities need fresh, drinking water as an essential part of building a city. Pittsburgh is no different. In fact, in Pittsburgh, two rivers, the Monongahela and the Allegheny form a third, the Ohio, which on its passage through Pennsylvania, West Virginia, Ohio, Kentucky, Indiana, and Illinois, is the primary water source for over five million people. Within the city, the Allegheny River provides us, the people of Pittsburgh, with fresh water that we use on a daily basis.

illustration of the water cycle: condensation, precipitation, runoff, evaporation

If my water comes from the Allegheny River, what’s the difference between drinking tap water and river water? That’s where the Pittsburgh Water and Sewer Authority, or the PWSA, enters the picture. PWSA is the organization in charge of providing quality water throughout the city of Pittsburgh. The organization’s drinking water system “contains approximately 965 miles of water lines, five reservoirs, and 11 tanks with a water storage capacity of 455 million gallons” (pgh2o.com). And their process for making clean water looks like this. First, the collected river water is coagulated using ferric chloride, potassium permanganate, carbon, and catatonic polymer, which react to the polluting particles in the water, causing them to stick and clump together. The water is then taken through the filtration process, where it flows through pulverized anthracite coal and sand to remove any of the remaining particles. Afterwards, the water is disinfected with sodium hypochlorite, a type of chlorine compound that is used to remove microbial particles. Lastly, once the water has been completely purified, fluoride, the processed form of a naturally occurring mineral, is added back into the water as recommended by the Center for Disease Control to prevent tooth decay.

image of sewage treatment and water treatment over water cycle

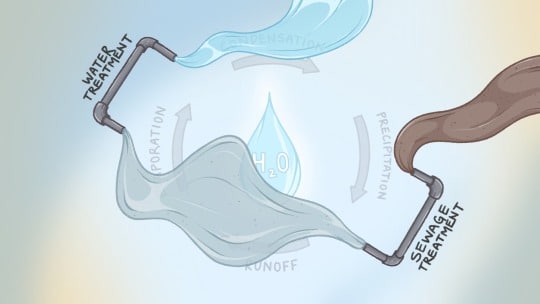
As complex as this purification process is, it isn’t perfect. The quality of the water that we receive is affected by what we put into it and there are countless compounds that cannot be completely filtered out by the processes used in water treatment plants. For example, trace amounts of dioxane, a likely human carcinogen from plastic manufacturing runoff, can be found in Pittsburgh’s own water system. Moreover, as of 2019, the PWSA has introduced orthophosphate in order to reduce lead levels, originating from the city’s ancient water pipes, in our tap water. In the end, all the water treatment plants can do is clean the water, test for contaminants, and research new ways to produce and deliver as clean a product as possible. The rest is up to us, the community. It’s up to us to be cautious of how we treat water by watching what we flush, preventing littering, or even reducing plastic use to reduce both microplastics and plastic production.

Water treatment is a growing process; new methods to remove previously unfilterable chemicals are constantly being discovered. With this in mind, think about your relationship with water. How do you treat it? What kind of objects do you flush down the toilet? What are your direct and indirect interactions with our water system? All of our actions matter. Because what we put into the river, will eventually come back to us.

Daniel Noh is an intern for the Center for Anthropocene Studies, Carnegie Museum of Natural History. Museum employees are encouraged to blog about their unique experiences and knowledge gained from working at the museum.

Resources

https://blogs.scientificamerican.com/guest-blog/the-purest-of-them-all/

https://www.portpitt.com/pages/monongahela-river

https://www.wpxi.com/news/what-you-need-to-know-about-pittsburghs-three-rivers/739536503/

http://www.orsanco.org/river-facts/

https://coolcosmos.ipac.caltech.edu/ask/67-How-much-water-does-Earth-have-#:~:text=There%20are%20more%20than%20326,in%20ice%20caps%20and%20glaciers

Related Content

The Inequity of Summer Heat

Hip and “Trashy” Ice Cream

Finding Nature in Your Local Streams

Filed Under: Blog Tagged With: Anthropocene, Anthropocene Living Room, Anthropocene Section, Anthropocene Studies, Daniel Noh, Museum from Home, Science News

June 12, 2020 by wpengine

The inequity of summer heat

photo of kids playing in a fountain

Ah, summertime! In Pittsburgh, after months of cold, grey days, the warm temperatures and sunshine bring a collective sigh of relief. Plants are roaring back, coloring the world green. Animals are out and about singing and foraging; people are picnicking, barbequing, gardening. Life feels abundant. But summer can quickly become oppressive, even deadly, if it gets too hot. Extreme heat is among the deadliest weather-related phenomena in the US, and cities are most at risk for this hazard.

The concentration of impervious surfaces and low-rise buildings in cities raises temperatures significantly, creating what is termed the urban heat island effect. Temperatures in a single urban area can vary as much as 18 F depending on the density of the grey stuff (buildings, sidewalks, roadways, and parking lots) relative to the green stuff (trees, parks). The urban heat island effect also interacts with global climate change. Rising temperatures due to emissions of heat-trapping gases from the extraction and burning of fossil fuels is making urban communities increasingly vulnerable to extreme heat. And like so many other pressing issues in the early summer of 2020, namely the coronavirus pandemic and police violence, extreme heat is experienced inequitably.

In the US, communities of color and resource limited communities are both disproportionately exposed and sensitive to extreme heat. One recent study explores this climate inequity and its relationship to the historic racially discriminating housing policy, called ‘redlining’. In an analysis published in the journal Climate in January 2020, Jeremy Hoffman, Chief Scientist at the Science Museum in Virginia, and colleagues ask: “do historical policies of redlining help to explain current patterns of exposure to intra-urban heat in US cities? and how do these patterns vary by geographic location of cities?” As the study describes, in the 1930s, redlining distinguished neighborhoods that were considered “best” (outlined in green) and “hazardous” (outlined in red) for investment by the Home Owner’s Loan Corporation, a federally funded program. Categorization on a scale from A (best) to D (hazardous) was based largely on racial makeup. The program prioritized white neighborhoods for economic investment and access to credit. While the practice ended in 1968 with passage of the Fair Housing Act, its legacy has persisted in structuring the social-economic and ecological landscape of US cities today. The study examines the pattern of land surface temperatures in cities today in relation to historic housing policy.

The results for 108 urban areas in the United States can be explored in an open access article, and also shared through an explorable map. Overall, Hoffman and colleagues found that yes, for 94% of US cities, historical policies of redlining track surface land temperatures. Historically redlined neighborhoods are about 5 degrees F warmer on average today than historically greenlined neighborhoods. While temperature patterns within a city are complex and influenced by microclimates and other factors, the authors argue that the heat burden in redlined neighborhoods has been aggravated by housing policy. Redlined neighborhoods have significantly fewer trees, and an abundance of public highway projects and large building projects that create especially high asphalt to vegetation ratios.

Examining the map of the analysis in Pittsburgh, shows a complex relationship between redlining and land surface temperature, part of which I would guess reflects our extremely variable topography and a complex history of shifting neighborhood demographics associated with the boom and bust of the steel industry. I encourage you to investigate the results yourself.

Hoffman’s research demonstrates how structural inequities and institutional racism in the US affects people’s differential experience with the Anthropocene. Anthropocene challenges, like global warming and global pandemics, reveal the coupled dynamics among human social-economic-political systems and ecological-climate systems. They reveal the way that discriminatory race-based policies from the past animate the present. The experience of the pandemic, the experience of summer heat, the experience of poor air quality, the experience of police violence, the list goes on, are not evenly felt across communities. In the US, research shows time and time again that low resource communities and communities of color are disproportionately suffering. In the processes of doing sustainability and adaptation to address the Anthropocene, the work of undoing injustice is essential. In the case of increasing urban heat, as cities adapt, an important research and practice will involve work to ensure greening policies undo racial discriminatory neighborhood investing practices, while also ensuring protection from gentrification and displacement.

Putting research into practice, Hoffman in his role at the Science Museum of Virginia, is collaborating with youth community organization, Groundwork RVA, to build solutions to urban heat that are both low-cost and high impact. At CMNH’s Center for Anthropocene Studies we are inspired and motivated by the role that museums are playing in empowering communities to understand global change and build social equity and resilience.

Nicole Heller is Curator of Anthropocene Studies at the Carnegie Museum of Natural History. Museum employees are encouraged to blog about their unique experiences working at the museum.

Filed Under: Blog Tagged With: Anthropocene, Anthropocene Living Room, Anthropocene Section, Anthropocene Studies, Museum from Home, Nicole Heller, Science News

May 26, 2020 by wpengine

South American Hippo Habitat

two South American hippo toys

In the wake the groundbreaking exhibition, We Are Nature, museum educators increasingly recognize opportunities for existing exhibits to foster discussions of profound human impacts. Because of a recent research study published in Proceedings of the National Academy of Science, even these sturdy plastic components of the African Wildlife Play Table (above) can spark wide ranging discussions about the impacts of large animal relocations.

The research paper Introduced herbivores restore Late Pleistocene ecological functions, by ecologist Erick Lundgren (University of Technology, Sydney, Australia) and ten co-authors, documents the establishment and growth of a hippo population along a section of Columbia’s Magdalena River over the past three decades. The founding members of a population now estimated to include as many as 80 individuals were four hippos, three females and one male, acquired during the 1980s by notorious drug lord Pablo Escobar for a private zoo on his estate.

According to researchers, the population of Magdalena River hippos could grow to between 800 and 5,000 animals by the year 2050.

For a summary of the research and its implications by The New York Times science writer Asher Elbein, please visit “Pablo Escobar’s Hippos Fill a Hole Left Since Ice Age Extinctions.”

Patrick McShea works in the Education and Visitor Experience department of Carnegie Museum of Natural History. Museum employees are encouraged to blog about their unique experiences and knowledge gained from working at the museum.

Filed Under: Blog Tagged With: Anthropocene Living Room, Anthropocene Studies, Education, Educators, mammals, Museum from Home, Pat McShea, Patrick McShea

  • « Go to Previous Page
  • Page 1
  • Page 2

sidebar

About

  • Mission & Commitments
  • Directors Team
  • Museum History

Get Involved

  • Volunteer
  • Membership
  • Carnegie Discoverers
  • Donate
  • Employment
  • Events

Bring a Group

  • Groups of 10 or More
  • Birthday Parties at the Museum
  • Field Trips

Powdermill

  • Powdermill Nature Reserve
  • Powdermill Field Trips
  • Powdermill Staff
  • Research at Powdermill

More Information

  • Image Permission Requests
  • Science Stories
  • Accessibility
  • Shopping Cart
  • Contact
  • Visitor Policies
One of the Four Carnegie Museums | © Carnegie Institute | Privacy Policy | Terms of Use | Accessibility
Rad works here logo