• Skip to primary navigation
  • Skip to main content
  • Skip to primary sidebar

Carnegie Museum of Natural History

One of the Four Carnegie Museums of Pittsburgh

  • Visit
    • Buy Tickets
    • Visitor Information
    • Exhibitions
    • Events
    • Dining at the Museum
    • Celebrate at the Museum
    • Powdermill Nature Reserve
    • Event Venue Rental
  • Learn
    • Field Trips
    • Educator Information
    • Programs at the Museum
    • Bring the Museum to You
    • Guided Programs FAQ
    • Programs Online
    • Climate and Rural Systems Partnership
  • Research
    • Scientific Sections
    • Science Stories
    • Science Videos
    • Senior Science & Research Staff
    • Museum Library
    • Science Seminars
    • Scientific Publications
    • Specimen and Artifact Identification
  • About
    • Mission & Commitments
    • Directors Team
    • Museum History
  • Tickets
  • Give
  • Shop

CRSP

September 7, 2023 by Erin Southerland

We Get Questions: Climate Change, Hope, and Action

by Patrick McShea
a paperback copy of the book "The Sixth Extinction"

“Tell me what gives you hope?” The student’s question during a high school environmental science class in March left me scrambling to deliver a clear and honest answer. “Tell me,” she added for emphasis, “because I really want to know.”

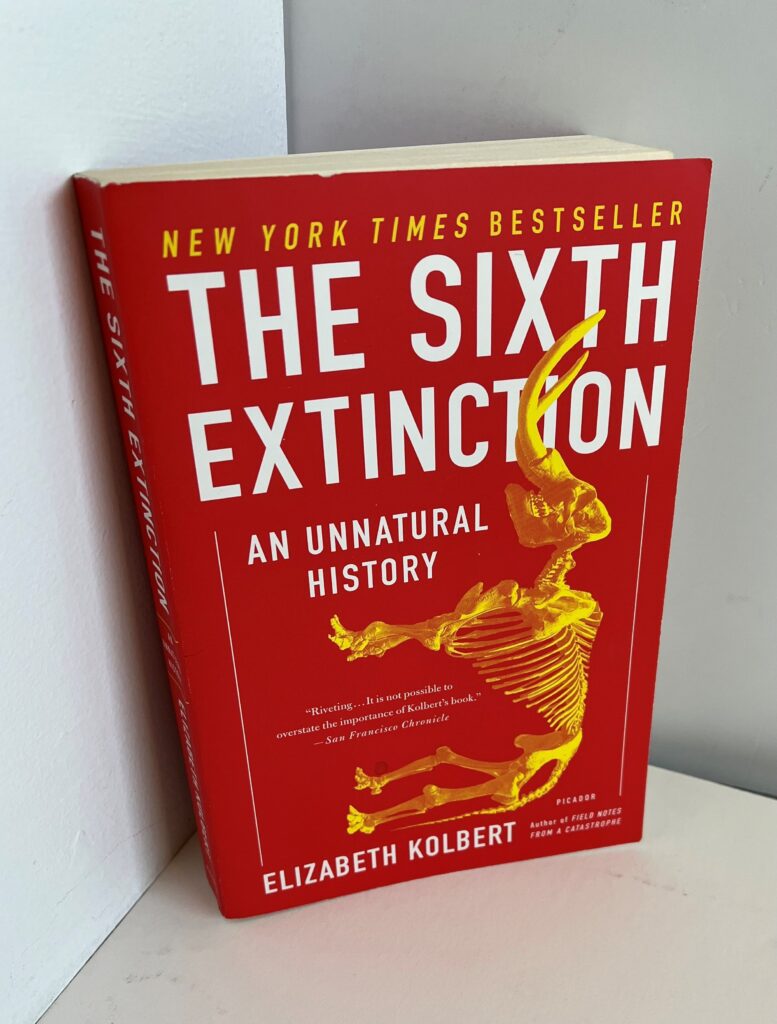
Ten students had just listened to me explain the cascade of negative effects associated with the increasing acidification of ocean waters. The frightful phenomenon is on a scale proportional to and correlated with the climate altering changes in Earth’s atmosphere. My presentation was a summary of a single chapter in The Sixth Extinction, science writer Elizabeth Kolbert’s landmark 2014 book exploring warning signs of a coming human-induced extinction event as destructive as the five previous episodes documented in the fossil record.

In “The Sea Around Us,” a chapter whose title pays homage Rachel Carson’s best-selling 1951 book by that name, Kolbert frames her ocean report with an explanation of a vital large-scale chemical interaction:

Ocean covers seventy percent of the earth’s surface, and everywhere that water and air come into contact there’s an exchange. Gases from the atmosphere get absorbed by the ocean and gases dissolved in the ocean are released into the atmosphere. When the two are in equilibrium, roughly the same quantities are being dissolved as are being released. Change the atmosphere’s composition, as we have done, and the exchange becomes lopsided: more carbon dioxide enters the water than comes back out. 

Much of the chapter consists of Kolbert’s account of her visit with scientists studying marine life in a bay of the Tyrrhenian Sea where water chemistry has long been impacted by carbon dioxide-rich discharges from submerged volcanic vents. The narrative helped the students understand how researchers use models to make predictions, and that ecological models are not always computer simulations. In a summary of acidification impacts in the study area, Kolbert notes limpet shells bearing “deep lesions through which their owner’s putty-colored bodies can be seen.” Perhaps my sharing of this type of graphic detail spurred the student’s urgent question about hope.

My answer, which lacked quotable coherence, involved trees. Speaking directly to the questioning student, but addressing the entire class, I explained how for more than a decade my New Year’s resolution has been simply to learn more about trees, and that months earlier a New York Times profile of renowned medical biochemist and botanist Diana Beresford-Kroeger had been particularly instructive. Her endorsement of global forest restoration to mitigate the effects of climate change is clear, and some of her research has identified biochemical connections between forests and the sea.

Although I’m not certain my answer alleviated the student’s concerns, I’ll lead with trees if the question of hope comes up again. However, because of a subsequent encounter with another student’s direct question, my answer will also include a human element. 

CRSP Project Climate Cards are designed as discussion prompts.

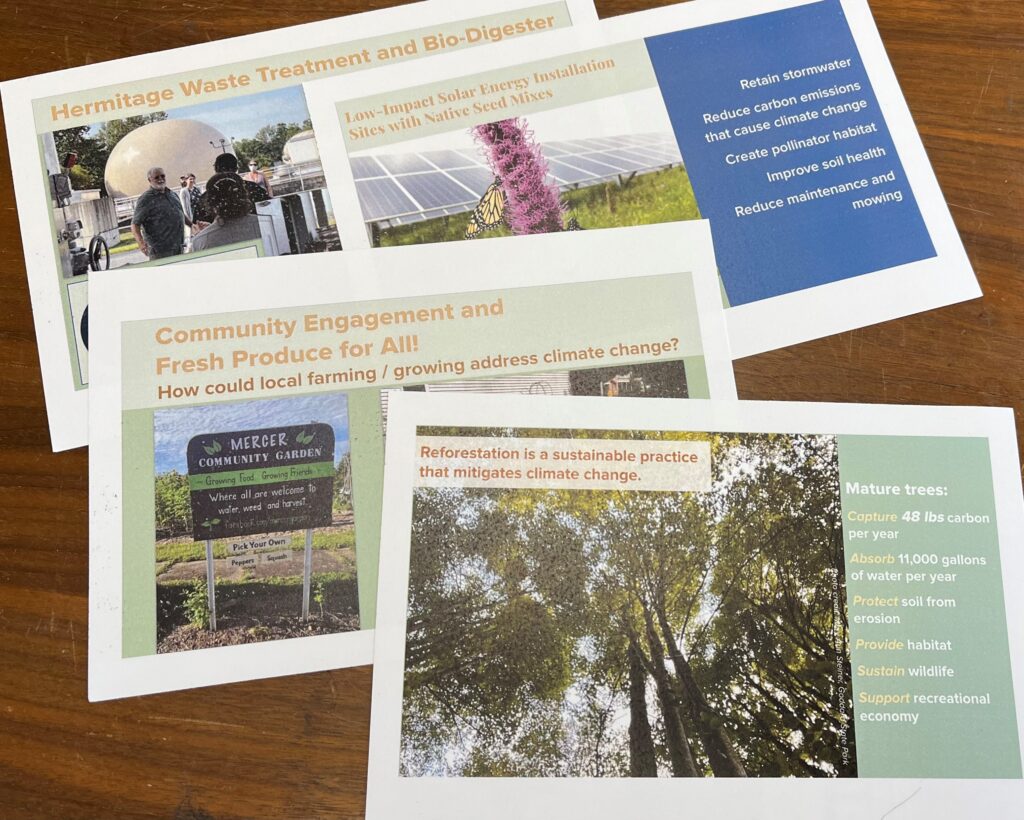
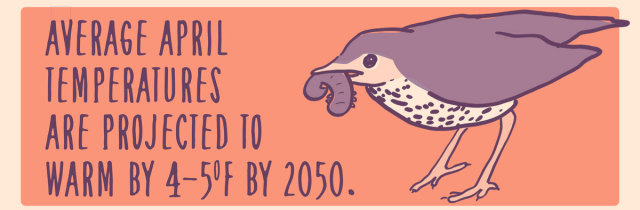
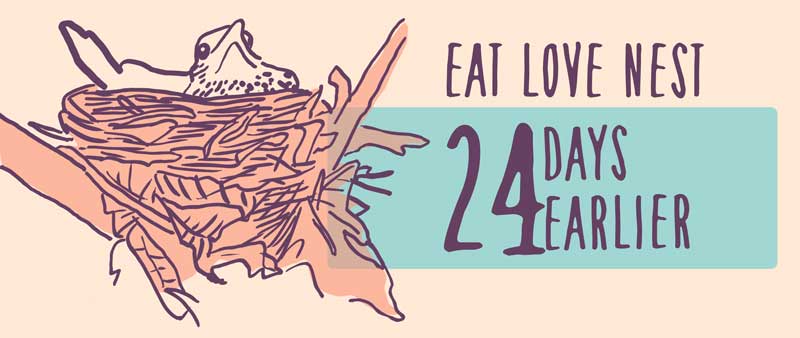
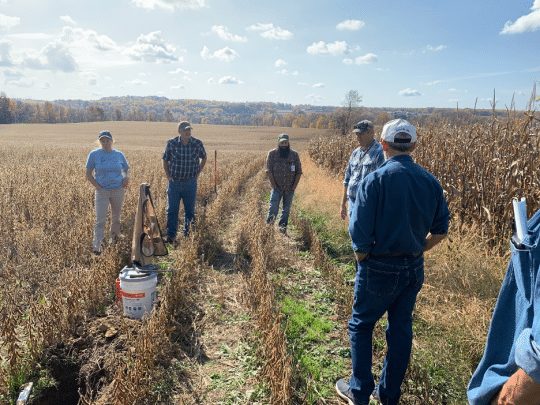
In early April, in collaboration with staff of the Mercer County Conservation District, I was one of two museum educators who spent a morning at that organization’s Munnell Run Farm headquarters assisting teams of local high school students in building climate change background knowledge as preparation for competition in the state-wide Envirothon. As encouragement for full participation in discussions, we relied upon colorful issues-focused information cards that were co-developed with partner organizations during the Climate and Rural Systems Partnership project. The climate cards were effective tools, but in one session a student with deep interest in climate change issues used a direct question to announce her enthusiasm for short cutting the process: “What should I do? I’m sold on all this, so tell me, as a high school student, right now, this month, this year, what should I be doing?”

I advised her to become as well informed as possible about climate change issues so she could better recognize solutions and mitigation efforts, and more effectively represent herself, her school, her family, and her community at relevant hearings or other public meetings. What I couldn’t articulate was that her engaged stance was something I could later point to as a sign of hope. 

Carnegie Museum of Pittsburgh offers free membership for teens. For additional information please visit the teen membership info page.

Patrick McShea is an educator at Carnegie Museum of Natural History.

Related Content

Hummingbird Lessons

Wolverine: Status Check for a Tournament Champion

Building Birding Skills

Carnegie Museum of Natural History Blog Citation Information

Blog author: McShea, Patrick
Publication date: September 7, 2023

Share this post!

  • Share on Twitter Share on Twitter
  • Share on Facebook Share on Facebook
  • Share on Pinterest Share on Pinterest
  • Share on LinkedIn Share on LinkedIn
  • Share on Reddit Share on Reddit
  • Share via Email Share via Email

Filed Under: Blog Tagged With: Anthropocene, CRSP, Pat McShea

February 9, 2022 by Erin Southerland

Climate Change Myth Busting at the Museum

by Dr. Bonnie McGill

If you’ve visited the museum recently you may have noticed some new orange labels throughout the exhibit halls. These are part of an innovative visitor experience titled, We Are Nature: A New Natural History. I helped write the label you’ll find in Benedum Hall of Geology next to the oil and coal specimens. Its six-word headline reads “Burning fossil fuels causes climate change”. 

Tweet includes a selfie photo of the author in front of the new label. The tweet reads “That’s right—the fossil fuels exhibit @CarnegieMNH now states ‘Burning FF causes climate change’! A small but mighty change. #climatechange #scicomm” My twitter handle is @BonnSci and the museum is @CarnegieMNH.
Screenshot of a tweet I sent in December. 

This is an important exhibit update. When looking at a big chunk of coal, it’s hard to not think about climate change. Fossil fuel combustion is the leading cause of climate change. For example, from 2010-2019, burning fossil fuels (coal, oil, natural gas) accounted for 81-91% of total human-caused CO2 emissions (IPCC AR6 WGI 2021 ch 5 p 6). Over that same time period the measured global average temperature was 1.6-2.2 oF (0.9-1.2 oC) warmer than the pre-industrial global average temperature. This increase cannot be explained by natural processes (such as changes in solar irradiance or volcanoes), which actually decreased the temperature by 0.2 oF (0.1oC), according to the Intergovernmental Panel on Climate Change (IPCC) (IPCC AR6 WGI 2021 ch 3 p4).

While the museum has understood the science of anthropogenic climate change for many years, adding these new labels explicitly linking fossil fuels to climate change has created opportunities for new discussion and questions about what scientists know and what they don’t know. To help address these questions, the CMNH Natural History Interpreters have been working with the Climate and Rural Systems Partnership (CRSP) to bolster their climate conversation skills and climate science knowledge. One tool we at CRSP have developed with our regional network of community partners is a climate change myth busting resource that breaks down some of the most commonly repeated myths about climate change. 

Let me show you how the climate change myth busting resource works. For example, here is one myth we hear a lot:

“The climate has always changed, therefore this is natural.”

The guide provides three types of information to address the myth:

1. The science bottom line

Yes, the climate has always changed. This time it’s different. It’s more rapid than past changes and it can only be explained by human activity. 

2. The science in more detail (not a script, simply background information)

Past climate changes were dominated by naturally occurring cyclical changes in the Earth’s orbit and axis. Volcanoes and asteroid impacts have also changed the chemistry of the atmosphere and, thus, Earth’s temperature in the past. These forces continue to have effects. Today natural forces contribute a -0.2 oF effect on modern day global warming, which cannot explain the warming observed today. Human activities contribute a net increase of 1.4-2.3 oF. This means humans are having a 7- to 11-fold greater impact on global temperature than non-human forces of nature.

Scientists have 99.999% certainty that current climate change is human-caused. As the IPCC says “its unequivocal”. One of the strongest lines of evidence comes from comparing observed (past) global average temperatures with projections from climate models for the same time period. Only the climate models that include heat-trapping gas emissions from human activities match the observed temperatures (see plot below). Climate models that include only natural forces of climate change do not match observed changes in global temperature. 

Line graph of degrees C -0.5 to 2.0 on the vertical axis vs. year 1850-2020 on the horizontal axis. The lines stay near zero until about 1960 when the black (observed temperature) and brown (simulated temperature driven by humans and natural factors) move upward to about 1.5 degrees in 2020. The green line (simulated natural factors only) stays near zero and does not match the observed line.
Change in global surface temperature (annual average) as observed (in black) and simulated using human & natural (brown) and only natural (green) factors (both 1850-2020). Source: Intergovernmental Panel on Climate Change (IPCC) Working Group 1 (WG1) Sixth Assessment Report (AR6) Summary for Policymakers. https://www.ipcc.ch/report/ar6/wg1/#SPM

Additionally, fossil fuels are the only source of carbon (representing millions of years of plant-stored carbon) large enough to explain the observed increase in atmospheric CO2. The carbon isotopes in the CO2 match the carbon isotopes of fossil fuels. 

3. Ideas for moving the conversation toward solutions

Recognize that the person engaging in conversation seems to agree that the climate IS changing–shared agreement is vitally important.

It’s true the Earth’s climate has always changed—our planet has had ice ages and Hothouse periods caused by natural changes in the Earth’s orbit and axis, changes in solar irradiance, and volcanoes. This time it’s different. Natural cycles, solar energy, and volcanoes alone are not enough to explain the increase in atmospheric CO2 concentrations and Earth’s temperature. Human emissions of greenhouse gases, primarily from the burning of fossil fuels, do explain the increase in CO2 and temperature.

Knowing it is human-caused means it can be human-solved! It is important that we’re on the same page about the cause of climate change, so that we can develop effective solutions. For example, you could say, “Perhaps you might be interested in learning more about climate solutions, many of which improve other conditions too like our health?” For solutions to talk about see Project Drawdown. Transitioning to renewable energy will benefit air and water quality and human health.

Climate change information added to galleries, and training staff on climate science and techniques for talking about it in friendly ways, are just a few examples of how the scientists, educators, and exhibitions team are working together at CMNH to explore Anthropocene topics like climate change. We want to engage museum visitors and work with our regional communities to have productive climate conversations, open discussions that are oriented toward climate solutions and a positive future. Because at the end of the day that is what really matters. 

May 2022 update: Here is the completed myth busting resource, “Breaking up with climate myths with climate fact flip cards.” 

We also recommend this resource from our partner the Climate Advocacy Lab for learning more about having relational climate conversations.

Bonnie McGill, Ph.D. is a science communication fellow for the Climate and Rural Systems Partnership and based in the Anthropocene Studies Section at Carnegie Museum of Natural History. Museum staff, volunteers, and interns are encouraged to blog about their unique experiences and knowledge gained from working at the museum.

Related Content

What Does Climate Change Mean for Western PA Farmers?

Understanding Fossil Fuels Through Carnegie Museums Exhibits

Guiding a Local Focus on Climate Education

Carnegie Museum of Natural History Blog Citation Information

Blog author: McGill, Bonnie
Publication date: February 10, 2022

Share this post!

  • Share on Twitter Share on Twitter
  • Share on Facebook Share on Facebook
  • Share on Pinterest Share on Pinterest
  • Share on LinkedIn Share on LinkedIn
  • Share on Reddit Share on Reddit
  • Share via Email Share via Email

Filed Under: Blog Tagged With: Benedum Hall of Geology, Bonnie McGill, Carnegie Museum of Natural History, CRSP, We Are Nature 2

April 30, 2021 by wpengine

Warmer Springs and Earlier Birds

by Bonnie McGill

Male Red-winged Blackbird (Agelaius phoeniceus) by Jonathan Eckerson via Macaulay Library.

Male Red-winged Blackbirds! For me, their calls and bright red shoulders are one of the signs that spring is really here. Mind you, this is no subtle sign of spring that takes an expert naturalist to notice. No, this is a sign of spring that slaps you across the face, as if spring is calling, “I’m here! CONK-A-REE! Look at me!” Next time you drive past a wetland area with cattails, there is a good chance you’ll see one or more showing off their red shoulders (the brown females are beautiful too). Red-winged Blackbirds have been back in western PA and announcing their territorial claims since March. Whether you live in the country or the city, bird watching is a great way to observe the change in seasons and connect with the nature around you (and in you).

As a member of the Climate and Rural Systems Partnership (CRSP) team I’ve been gathering evidence-based stories of how climate change is impacting natural processes in western PA. Since this week is the City Nature Challenge, folks might be paying closer attention to birds, creating an opportunity for museum scientists to explain what migratory songbirds in our region can teach us about climate change.

Since 1961 scientists at the museum’s Powdermill Avian Research Center (PARC) in Pennsylvania’s Laurel Highlands have been monitoring birds. In that time they have captured, studied, marked, and released almost 800,000 birds! This week, for example, PARC’s mist nets are temporarily capturing birds like the Common Yellowthroat, Yellow Warbler, House Wren, Ruby-throated Hummingbird, American Redstart, and Wood Thrush.

Migratory birds that are part of the PARC long term dataset (clockwise from left): Wood Thrush, Common Yellowthroat, Yellow Warbler, and Ruby-throated Hummingbird. All of these species are breeding earlier in the year in response to climate change that has already occured. Photos courtesy of Powdermill Avian Research Center.

All of these species are migratory–spending the winter in the southern US, the Caribbean, Central America, and/or South America. Many fly across the Gulf of Mexico (!) on their way north in the spring. All of these birds share another trait–they are nesting earlier in the year than they once did. We will follow the Wood Thrush as an example of how many birds are responding to the warming climate.

on the right side, text reads "Average April temperatures are projected to warm by four to five degrees Fahrenheit by 2050." On the left, there's an illustration of a bird holding a worm in its beak.
The artwork in this blog post is by the author and part of an infographic depicting the information written here.

PARC’s unique 50 year dataset allows scientists to study how birds respond to long term changes, including the warming climate. Average April temperatures in the Laurel Highlands have already increased by two degrees Fahrenheit since the 1960s, and are projected to warm by another four to five degrees Fahrenheit by 2050. Warmer springs trigger earlier plant budburst. Insects, especially caterpillars, feast on buds and young leaves, which have less toxins than mature leaves. Caterpillars are the breakfast of champions (among birds). So, migratory songbirds, including the Wood Thrush, need to synchronize their northward movement with the budburst. This means an earlier arrival, according to the calendar, at points all along their migration route.

Wood Thrushes arrive from Central America five days earlier than they did in the 1960s. Research suggests that migratory birds respond to temperature cues along their migration route and speed up (warmer temperatures) or slow down (cooler temperatures). Birds may be responding to temperature directly or indirectly via other temperature-dependent cues such as wind speed and direction and spring leaf out.

Eat, Love, Nest, 24 days earlier

Early arrival is not the only adjustment Wood Thrushes are making, however. The birds are also making their nests and hatching young earlier. Wood Thrushes are nesting 24 days earlier than they did in the 1960s. All four of the  bird species in the photo above are breeding earlier. Within the web of organisms that supplies food for birds, May 19 of the present feels like June 11 of the 1960s. The earlier nesting in response to a warming climate means birds that normally hatch and rear multiple broods per breeding season, such as House Wrens and Northern Cardinals, may  have greater reproductive capacity. PARC research shows that Gray Catbirds and Northern Cardinals are having more young in warmer springs, but other multi-brood species such as House Wrens and Common Yellowthroats are not.

While birds seem to be keeping pace with climate change now, they may not be able to in the future. Their capacity to adjust migratory and reproductive behavioral traits in response to climate change is finite. Also, we’ve already lost an estimated 3 billion North American birds since 1970 due to factors including habitat loss, insect declines, pesticide use, and predation by domestic cats. Now climate change is making bird survival even more difficult. The capacity of bird populations to evolve in response to climate change is also limited – climate change in the Anthropocene is happening much more rapidly than climate change in past epochs, many times faster than evolution can keep up. The good news is we can help birds, ecosystems, and ourselves by taking action to reduce the severity of climate change.

illustration of two birds flying with the text "You can help birds and climate"

Here are three ways individuals and communities can help birds by mitigating climate change:

1) Conserve habitat: Habitats like forests, wetlands, and prairies provide food and shelter for birds while the plants and soils remove and store carbon away from the atmosphere. These habitats are needed throughout birds’ migratory ranges. Create habitat by reducing lawns and planting native plants. For example, many birds enjoy eating the fruits of spicebush, elderberry, and black cherry, which are native to western Pennsylvania. You can find more bird-friendly plants native to your area at https://www.audubon.org/plantsforbirds.

2) Renewable energy: A just transition to renewable energy sources like properly-sited wind* and solar will reduce greenhouse gas emissions, provide local jobs, improve air quality, and help protect birds and people from climate change. *The National Audubon Society supports properly-sited wind energy.

3) Eat your vegetables: A more plant-based diet is an impactful way to reduce greenhouse gas footprints. Also, choosing food that is grown with less pesticides, and using less pesticides in the stewardship of your garden, helps support the survival of insects that are food for birds. Reductions in demand for pesticides also reduces their manufacture, which further reduces greenhouse gas emissions. Learn more from Project Drawdown.

So get out there, find the signs of spring that are gentle (Trout Lilies) and not-so-gentle (Red-winged Blackbirds), log them in iNaturalist for the City Nature Challenge, and talk with your family and your community about how you can implement one or two (or three!) of the actions suggested above!

You can also read this as an infographic here.

Thank you to the many folks who helped with the development of this blog post and infographic: Luke DeGroote, Mary Shidell, and Annie Lindsay at PARC; the Laurel Highlands network of the Climate and Rural Systems Partnership; Nicole Heller; Taiji Nelson; and Sarah Crawford.

Bonnie McGill, Ph.D. is a science communication fellow for the Climate and Rural Systems Partnership and based in the Anthropocene Studies Section at Carnegie Museum of Natural History. Museum employees are encouraged to blog about their unique experiences and knowledge gained from working at the museum.

Related Content

Teaching About Local Wildlife with the City Nature Challenge

Water Bears: Why My Yard is Like the Moon

Botanists Use Data Collected By Thoreau to Uncover Unexpected Effects of Climate Change

Carnegie Museum of Natural History Blog Citation Information

Blog author: McGill, Bonnie
Publication date: April 30, 2021

Share this post!

  • Share on Twitter Share on Twitter
  • Share on Facebook Share on Facebook
  • Share on Pinterest Share on Pinterest
  • Share on LinkedIn Share on LinkedIn
  • Share on Reddit Share on Reddit
  • Share via Email Share via Email

Share this post!

  • Share on Twitter Share on Twitter
  • Share on Facebook Share on Facebook
  • Share on Pinterest Share on Pinterest
  • Share on LinkedIn Share on LinkedIn
  • Share on Reddit Share on Reddit
  • Share via Email Share via Email

Filed Under: Blog Tagged With: Anthropocene, Anthropocene Living Room, Anthropocene Studies, Bonnie McGill, City Nature Challenge, climate change, CRSP

November 10, 2020 by wpengine

What Does Climate Change Mean for Western PA Farmers?

Agriculture is many things when it comes to climate change: a source of heat trapping gases, a casualty of extreme weather events, and part of the solution. At Carnegie Museum of Natural History, we’re working with rural communities in western Pennsylvania to talk about climate change in conversations that connect the dots between agriculture as a source of emissions, a sector of vulnerability, and an under explored reservoir of much needed solutions. This work is happening through the Climate and Rural System Partnership (CRSP, which we pronounce “crisp”), a National Science Foundation-funded program involving three CMNH components (the Education Department, the Section for Anthropocene Studies, and Powdermill Nature Reserve), partner researchers at the University of Pittsburgh’s Center for Learning Out of School Environments, and the Mercer County Conservation District. In CRSP, we are using methods of co-production and co-design to develop climate change science and communication resources with our community partners that are relevant to the lived experiences and concerns of those partners’ and their audiences.

How is climate change impacting farmers in western PA? What would help them to make adaptive planning decisions? What mitigation actions are most attractive to western PA farmers and will best help to sustain livelihoods into the future? Are Western PA farmers already, or interested in becoming, climate champions–leading their community in mitigating and adapting to climate change on their farm?  How can the museum help? These are some of the questions we are exploring in CRSP.

Working alongside local livestock and row crop farmers, Penn State agriculture extension educators, and representatives of the Natural Resource Conservation Service (the agency formerly known as the U.S. Soil and Conservation Service), and the Mercer County Conservation District (a CRSP network hub), I have the privilege of exploring these issues and co-producing useful communication resources. Co-production is an iterative collaboration involving diverse perspectives to produce locally relevant knowledge and solutions (Norstrom et al 2020, Meadows 2015). Instead of scientists being the sole creators of new knowledge, in co-production all are creators of new knowledge.

Mercer County Conservation District, CRSP partners, and other Mercer area farmers at a soil health workshop and demonstration in a no-till soybean field at Goddard State Park.

CRSP partners and I have started by developing an agriculture working group at the Mercer hub (also called the Shenango Climate and Rural Environmental Studies Team or Shenango CREST). In this group, we have compiled climate thresholds, which are climate data types that are meaningful to the everyday lives of farmers in Shenango River Valley. Global averages are not applicable here, instead we’re looking for things that affect farmers’ decision making or impacts the physical conditions required to operate. To do this, I asked the group “How do we make existing climate data, past and present, most useful? What connects climate to the everyday life of a farmer of both row crops and livestock. What is going to mean something when we talk with farmers in the Mercer area?“ Some of the thresholds that the group identified were: too much rain in the spring for planting crops, too much rain in the fall for harvesting the crops, and warmer winters in which the ground does not freeze leading to problems for soils and livestock.

Here’s an example of how the co-production process works. First, I found the best available data from 11 rural weather stations in the western PA region, each with 80-100 years of daily rainfall and temperature measurements, obtained from the National Oceanic and Atmospheric Agency’s Climate Data Online tool. Then, one of the network members identified a climate threshold as how the “July and August heat hurts milk production.” So, I explored the data to see what is happening with summer heat in rural western PA: has it been getting hotter? Will this continue in the future?

The short answer is yes. One analysis I used to explore these questions looks at the daily minimum temperatures. Warming daily minimum temperatures would mean less relief at night for the livestock as well as for crops. So, I conducted statistical analyses, and created a “rough draft” data visualization showing the minimum temperatures per month and the increasing trend over time in all months except April, May, and June (see figure below).

Preliminary analysis and rough draft visualization of monthly minimum temperatures for 1900-2020 from 11 western PA long term weather stations. Numbers at the top of each panel indicate the month. Red lines indicate a statistically significant increase over time. Each gray dot represents one weather station’s monthly minimum for that year.

Regarding dairy cows in the summer heat, this analysis revealed that since 1900 the coolest August nights have warmed 7oF in our region. Upon seeing this, one of the network members said, “Really great, local data, people can feel like they can trust it.” Another reacted, “Interesting to take a piece of climate change, make it understandable and relatable. Put science to something already happening, a thing they [farmers] are living.” The visualization prompted talk of impacts on milk production as well as changes in calving time, lambs needing shearing more often, and with soils not freezing as much in the winter, hooved animals face a potentially greater parasite load from the mud in the warmer months.

This successful first iteration of CRSP co-production suggests we are identifying climate trends with which local farmers can personally identify. Into the future, climate projections for low and high emissions scenarios show the number of days per year over 90oF in Mercer County increasing, and highlights how mitigation of climate change now will reduce that increase in temperature.

With these kinds of analyses, the Mercer agriculture working group is aiming for evidence-based and locally relevant outputs in the form of talking points, maps, and graphs about climate change impacts and solutions. We will also collect personal stories of network members and people they know that illustrate a shared experience among people in the region and a hopeful message of climate adaptation and/or mitigation.

Impacts of this work, we hope, will be to bring the narrative about climate change from insurmountable, global, and blaming, to a community-scale conversation that is tractable, local, and hopeful. Within the museum itself, this work will help us better understand how to better serve rural audiences, bridge rural and urban connections (not divisions), and have productive conversations about socio-scientific issues that cut through politicization and misinformation. The diverse connections between climate change and food production provides a “ripe” opportunity to explore how to have such conversations.

Bonnie McGill is a science communication fellow in the CMNH Anthropocene Section. Museum staff, volunteers, and interns are encouraged to blog about their unique experiences and knowledge gained from working at the museum.

Works cited:

Norström, A.V. et al. 2020. Principles for knowledge co-production in sustainability research. Nature Sustainability 3:182-190. https://doi.org/10.1038/s41893-019-0448-2

Meadow, A.M. et al. 2015. Moving toward the Deliberate Coproductin of Climate Science Knowledge. Weather, Climate, and Society 7:179-191. https://doi.org/10.1175/WCAS-D-14-00050.1

Related Content

Ask a Scientist: What is an amphibian party?

Thanksgiving and Nutritional Mineralogy

The Surrounding Trees Whispered with Their Leaves

Filed Under: Blog Tagged With: Anthropocene, Anthropocene Living Room, Bonnie McGill, CRSP, We Are Nature 2

sidebar

About

  • Mission & Commitments
  • Directors Team
  • Museum History

Get Involved

  • Volunteer
  • Membership
  • Carnegie Discoverers
  • Donate
  • Employment
  • Events

Bring a Group

  • Groups of 10 or More
  • Birthday Parties at the Museum
  • Field Trips

Powdermill

  • Powdermill Nature Reserve
  • Powdermill Field Trips
  • Powdermill Staff
  • Research at Powdermill

More Information

  • Image Permission Requests
  • Science Stories
  • Accessibility
  • Shopping Cart
  • Contact
  • Visitor Policies
One of the Four Carnegie Museums | © Carnegie Institute | Privacy Policy | Terms of Use | Accessibility
Rad works here logo