• Skip to primary navigation
  • Skip to main content
  • Skip to primary sidebar

Carnegie Museum of Natural History

One of the Four Carnegie Museums of Pittsburgh

  • Visit
    • Buy Tickets
    • Visitor Information
    • Exhibitions
    • Events
    • Dining at the Museum
    • Celebrate at the Museum
    • Powdermill Nature Reserve
    • Event Venue Rental
  • Learn
    • Field Trips
    • Educator Information
    • Programs at the Museum
    • Bring the Museum to You
    • Guided Programs FAQ
    • Programs Online
    • Climate and Rural Systems Partnership
  • Research
    • Scientific Sections
    • Science Stories
    • Science Videos
    • Senior Science & Research Staff
    • Museum Library
    • Science Seminars
    • Scientific Publications
    • Specimen and Artifact Identification
  • About
    • Mission & Commitments
    • Directors Team
    • Museum History
  • Tickets
  • Give
  • Shop

James Whitacre

December 31, 2018 by wpengine

From Metes and Bounds to GPS: Part 2

By James Whitacre

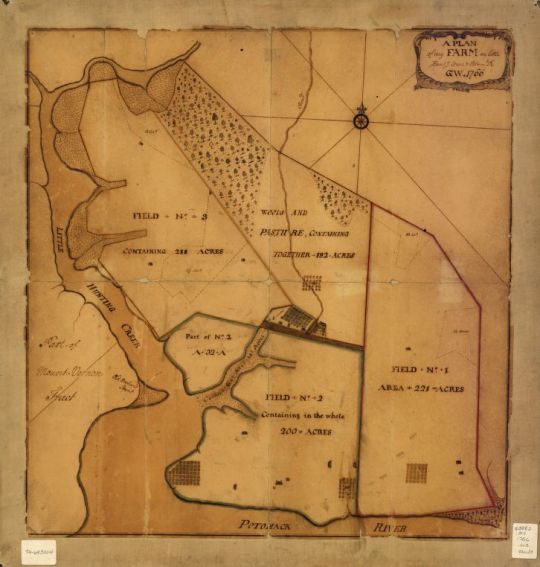
In my last post I talked about how surveyors and cartographers used chains and compasses to survey the land. They also used the system of metes and bounds to describe the data they collected, typically for land ownership purposes. At the GIS Lab at Powdermill Nature Reserve, we no longer use these techniques of old when mapping research data in the field. But with today’s advances in technology, we use much different methods and tools to collect research data.

The primary tool used today for collecting data in the field is a GPS receiver, as you might have guessed. At Powdermill, we use these devices to quickly and efficiently record latitude, longitude, and altitude. We can also couple GPS receivers with mobile apps to help us collect other non-spatial data.

To learn more about projects that use mobile apps and GPS, I recommend checking out the BirdSafe Pittsburgh program and our effort to map plastic waste.

However, you may be wondering, what exactly is GPS…and what does it actually stand for? The Global Positioning System (GPS) is operated by the US Air Force and has been around since 1978. It is a world-wide constellation of over 30 satellites that are constantly in orbit around the earth. With just four satellites in view, the location of the GPS device can be determined by using a process called trilateration, which measures the distances between multiple satellites and the device on the ground (I’m not going to get into the technical math…). GPS is also just one of a few other global navigation satellite systems (GNSS), as Russia, China, and the European Union all have operational systems as well. Many GPS devices utilize all GNSS systems.

There are many different types of GPS devices and they are generally categorized into three accuracy levels: recreational grade (accurate from 3 to within 10 meters), mapping grade (0.5 to 3 meters), or survey grade (1 millimeter to 0.5 meters). If your smartphone has GPS on it, as most do, that is considered a recreational grade GPS device. Other recreational GPS devices, such as Garmin devices, are fairly affordable and can be found at sporting goods stores. More sophisticated GPS devices for mapping and surveying are not typically found in stores and must be ordered from specialty vendors.

GIS lab mapping tools including GPS

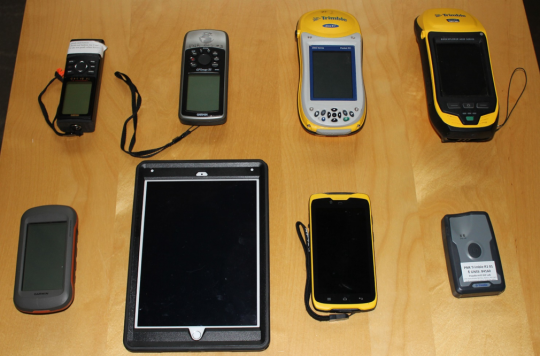
The above image shows the different devices the GIS Lab has used over the years. At Powdermill, we use mapping grade GPS devices most often, as represented by the four devices on the right in the image above, but we also use recreational GPS devices and GPS-enabled mobile devices, which are the four devices on the left. We no longer use the top row of devices as the devices on the bottom row are newer technology that vastly outperform the older devices. The need for survey grade GPS devices is not typically needed for research at Powdermill, as one to three meters of accuracy is usually good enough for most ecological and field biology research.

By collecting research data with geographic information collected from GPS, we can analyze ecological phenomena in space, which allows us to discover much more about plant and animal communities. For example, we have used GPS to collect where trees are in addition to the species and size of the trunk. When we analyzed the distribution of our trees, we learned that red maples tend to grow on south facing slopes, while sugar maples tend to grow on north facing slopes. This information could impact future decisions for our forest management. Therefore, it is essential that we think spatially about our research!

James Whitacre is the GIS Research Scientist for Carnegie Museum of Natural History, where he primarily manages the GIS Lab at Powdermill Nature Reserve, the Museum’s environmental research center. Museum employees are encouraged to blog about their unique experiences and knowledge gained from working at the museum.

Filed Under: Blog Tagged With: GIS lab, GIS Research, James Whitacre, Powdermill Nature Reserve, research

November 12, 2018 by wpengine

From Metes and Bounds to GPS: Part 1

By James Whitacre

Did you know that George Washington was a cartographer? Well, technically his training was in surveying, but back in his time, surveyors would typically create beautiful maps to show off their surveys. Other famous Americans, such as Thomas Jefferson, Abraham Lincoln, and both Meriwether Lewis and William Clark, were also surveyors.

The map below is of one of Washington’s many farms near Mount Vernon, VA, which shows off his stellar map-making skills. Around the time when Washington was surveying land, the profession was gaining more ground as the industrial revolution was taking shape and the US was expanding.

map of George Washington's farm

A plan of my farm on Little Huntg. Creek & Potomk. R., George Washington, 1766; Source: Library of Congress

As I look in awe at Washington’s map, I can’t help but wonder how surveyors and cartographers collected and visualized their geospatial data before computers and GPS were around. It truly is a great mix of science and art. However, Washington and his fellow surveyors of antiquity used much different techniques than we use today.

Surveyors would use chains, rods (which were literally poles of a fixed length), and a surveyor’s compass or a Theodolite to quickly measure distances and angles. The Gunter’s Chain measured 66 feet long and contained 100 links. This chain could be used to measure many other lengths, for instance a rod (aka a pole or perch) equaled 25 chain links (16.5 feet), 10 chains equaled a furlong (660 feet or 1/8 mile), and 80 chains equaled one mile (5,280 feet). Further, an acre is defined as a one chain by one furlong (66 by 660 feet), which is 43,560 square feet (Are you able to follow all that math?).

The Theodolite contains an optical telescope with cross-hairs that is used to sight direction and then the angle or bearing can be read off a scale. Surveyors would also use sophisticated instruments such as zenith telescopes, sextants, or octants to determine the positions of the sun or stars which could also help with determining latitude and longitude.

By recording the measurements and angles or bearings from these instruments, surveyors would describe the land using a system called metes and bounds. This system also incorporates physical features, such as trees, stones, and streams, to describe the boundaries. Metes and bounds were originally used in England, and it is still used today, even in Pennsylvania. The image below is an example from one of Powdermill’s metes and bounds descriptions. Surveyors and cartographers can decipher these descriptions and use geometry (which comes from the Greek “earth measurement”) to find property boundaries in the field, or draw and chart the measurements on to paper, thus creating maps.

example of metes and bounds description

Example of Metes and Bounds description from Powdermill Nature Reserve; Source: Westmoreland County, PA, Recorder of Deeds

At the Geographic Information Systems (GIS) Lab at Powdermill Nature Reserve, we spend a lot of our time collecting scientific data for research in the field so that it can be mapped and analyzed. Today, however, we use sophisticated GPS units, mobile devices, and high-end GIS software to help us efficiently collect, analyze, and visualize our field data. Stay tuned for my next blog post where I will discuss how GPS works and how we use it in our everyday research at Powdermill Nature Reserve.

James Whitacre is the GIS Research Scientist for Carnegie Museum of Natural History, where he primarily manages the GIS Lab at Powdermill Nature Reserve, the Museum’s environmental research center. Museum employees are encouraged to blog about their unique experiences and knowledge gained from working at the museum.

Filed Under: Blog Tagged With: GIS Research, James Whitacre, Powdermill Nature Reserve

November 9, 2018 by wpengine

Keeping Birds Safe with GIS and Citizen Science

By Jon Rice and James Whitacre

Almost 600 million birds die every year in North America after colliding with buildings. BirdSafe Pittsburgh, which has been a museum program for over four years, has collected over 1,500 birds that collided with windows. These birds have been collected in Downtown and surrounding areas, and through our efforts, we have learned what increases the likelihood of birds colliding with windows.

windows modified with a pattern birds can see

Locating and Researching Bird Strikes

Using the power of Geographic Information Systems (GIS), we have been tracking and collecting where birds have collided with windows. This will help us to find collision hotspots and assess the types of buildings that cause the most problems for birds. Our efforts so far have concentrated on downtown Pittsburgh with a crew of dedicated volunteers.

However, we are now inviting you – the public – to help us find bird strikes in your neighborhood. We have developed a form on our website for you to add bird strikes to our database. If you find a bird dead or stunned, you can help us add to our database of bird strikes using the form. It will guide you through how to add pictures of the bird, add the location to the map, and fill out the required data. Any bird added will help us expand our research.

We already know that skyscrapers, low-rise buildings, and residential houses alike threaten birds, albeit unequally. According to a study published in 2014, low-rises account for the majority of building related mortalities at 56%, with residential houses accounting for nearly all the rest at 44%, and high-rises only accounting for less than 1%. But, how do the buildings in downtown Pittsburgh and the surrounding neighborhoods fit into this picture?

By analyzing the precise locations of bird strikes in Pittsburgh using GIS, we hope to assess the types of buildings impacting bird deaths. By collecting fine scale data where birds strike windows, we could identify specific problem windows that birds strike more often than others. This would allow us to focus mitigation efforts to specific areas of concern rather than along an entire building façade. For instance, treating 10 windows on a building side instead of all 100 windows would result in considerable cost-savings while maintaining the same effect on decreasing bird strikes.

How You Can Help Save Birds

bird sitting on the sidewalk

Birds hit windows because of the reflections caused by sunlight hitting the glass and looking like open sky, trees or habitat. By breaking up the reflections with anything following a “2-inch-by-4-inch rule,” birds are less likely to strike the window. The 2-by-4 rule refers to the space between horizontal elements at no more than 2 inches apart, and the space between vertical elements at no more than 4 inches apart. These simple and cost-effective measures will reduce window collisions while maintaining the aesthetic qualities.

By helping us collect bird strike data and modifying the windows of your home or business, we can decrease the number of bird-window collisions and maintain stronger bird populations.

More information about BirdSafe Pittsburgh can be found at birdsafepgh.org.

Jon Rice is Citizen Science Assistant and James Whitacre is a GIS Research Scientist at Carnegie Museum of Natural History’s Powdermill Nature Reserve. Museum employees are encouraged to blog about their unique experiences and knowledge gained from working at the museum.

Filed Under: Blog Tagged With: Birds, birdsafe pittsburgh, James Whitacre, Jon Rice, Pittsburgh, Powdermill Nature Reserve

July 23, 2018 by wpengine

Powdermill Flood Changes the Landscape

By James Whitacre

Here at Powdermill Nature Reserve, the Carnegie Museum of Natural History’s environmental research center, we were reminded of the ever-present forces of nature when a flood recently inundated the Ligonier Valley. Homes and buildings were damaged and numerous people had to be rescued by swift water rescue crews. At Powdermill, a few of our buildings also experienced damage (see the video at the bottom of this post).

water level chart

On June 20, 2018, over 5.5 inches of rain fell on Powdermill and the surrounding area in about 6 hours. At the nearest USGS stream gauge at Linn Run State Park, the water level rose about four feet in five hours. The force of the flood waters was able to move large boulders, take down trees, and change the course of many streams, including Powdermill Run. The flood levels were so high that we have reason to believe that this was a very significant flood event. But was it a ‘100-year flood’?

The concept of the ‘100-year flood’ is quite familiar, but this concept is a bit misleading. It does not mean that a flood event rated as a ‘100-year flood’ occurs every 100 years. Rather, it means that every year, there is a 1% chance that a flood will reach the annual exceedance probability (AEP) (i.e. the height of the flood waters in a particular area). On average, the AEP will reach that level every 100 years. This definition was established for the National Flood Insurance Program. For more information, see the USGS page The 100-Year Flood—It’s All About Chance.

So the question still stands, was the flood at Powdermill a ‘100-year flood’? Using the power of maps an GPS, the GIS lab at Powdermill decided to compare the FEMA flood zones map to the flood levels observed in the field. As the map shows, it appears that is is very close, though more assessment is needed to be certain.

See the map here.

While the damage was extensive, this event will provide researchers at Powdermill the opportunity to study yet another instance of how natural disasters affect the ecology and landscape of the nature reserve. A similar event six years ago, in June 2012, was when a tornado touched down in the Ligonier Valley and blew down nearly 50 acres of forest in the nature reserve. Powdermill continues to utilize these areas in numerous on-going research projects to track succession and plant-animal interactions after a disturbance. While the flood event may not produce an obvious research project at the moment, Powdermill researchers will be keeping their eyes open to see how we may need to respond.

James Whitacre is the GIS Research Scientist for Carnegie Museum of Natural History, where he primarily manages the GIS Lab at Powdermill Nature Reserve, the Museum’s environmental research center. Museum employees are encouraged to blog about their unique experiences and knowledge gained from working at the museum.

Filed Under: Blog Tagged With: James Whitacre, Powdermill, Powdermill Nature Reserve

sidebar

About

  • Mission & Commitments
  • Directors Team
  • Museum History

Get Involved

  • Volunteer
  • Membership
  • Carnegie Discoverers
  • Donate
  • Employment
  • Events

Bring a Group

  • Groups of 10 or More
  • Birthday Parties at the Museum
  • Field Trips

Powdermill

  • Powdermill Nature Reserve
  • Powdermill Field Trips
  • Powdermill Staff
  • Research at Powdermill

More Information

  • Image Permission Requests
  • Science Stories
  • Accessibility
  • Shopping Cart
  • Contact
  • Visitor Policies
One of the Four Carnegie Museums | © Carnegie Institute | Privacy Policy | Terms of Use | Accessibility
Rad works here logo